

AUM Advisors Insights
Three Paths to a US Listing
Three Paths to a US Listing
IPO, De-SPAC, or Direct Listing? An Evidence-Based Decision Framework for Management Teams and Boards of Overseas Companies
3
Distinct paths to a US listing — each suited to a different kind of company
57%
Share of 2025 US IPOs completed by companies headquartered outside the United States
1,100+
Transactions behind the evidence — every IPO,
de-SPAC, and direct listing since 2024, plus 699 de-SPACs since 2010
Prefer the formatted study? Download the PDF (English) · 日本語版PDF · 日本語で読む →
Who This Guide Is For
This guide is written for the management teams and boards of companies outside the United States that are considering a US listing — and who want a clear, evidence-based understanding of the three ways to get there before the pitch meetings begin.
If your company is weighing a US listing, you will hear from underwriters that the traditional IPO is the gold standard. You will hear from SPAC sponsors that a merger is faster and more certain. You may hear from advisors that a direct listing minimizes the fees and dilution associated with either an IPO or a de-SPAC.
Each of these claims is true for some companies and costly for others — and each advisor, however capable, is describing the product they sell.
Our aim here is different: to explain how each path works, what each one costs, what each one delivers, and — using the complete record of every US listing since 2024 — what actually happened to the companies that chose each door.
The US capital markets remain the deepest, most liquid, and most flexible in the world, and they continue to be open to qualified international issuers: 57% of 2025 US IPOs came from companies headquartered abroad, and 43% of the SPAC merger targets announced in the first half of 2026 are international. The opportunity is real. So are the differences between the different doors to the US markets.
A note on our evidence. Everything quantitative in this guide traces to a named source: Renaissance Capital’s IPO datasets, SPAC Insider’s de-SPAC universe, Jay Ritter’s academic data, SEC filings, and exchange trading records, supplemented by our own published research — The Five Disciplines of De-SPAC Success (699 completed de-SPACs since 2010), The De-SPAC Scorecard (quarterly), and Everything Is Negotiable (every H1 2026 merger agreement). Our goal is to provide unvarnished data and a framework for each company to weigh its options.
Why Companies List in the US — Three Objectives
Every going-public decision is ultimately a purchase of some combination of three things:
Primary capital — fresh money on the balance sheet to fund growth.
Liquidity — a trading market that lets founders, employees, and early investors convert ownership to cash over time, and lets new investors build positions.
Validation and reputation — a continuous public price, a listing on a globally recognized exchange, and the credibility that follows with customers, business partners, lenders, acquisition targets, and future investors.
These three objectives are the yardsticks this guide measures every path against. Most commentary — including, candidly, most research, ours included — measures only the first thing that is easy to measure: the share price.
Share price matters, and we present the evidence of trading data. But a listing that trades at a high price and never develops real trading volume has not delivered liquidity. A listing with no analyst coverage has not delivered validation. And a listing that cannot support a follow-on offering has not delivered durable access to capital.
This guide therefore adds two measures rarely put side by side: trading liquidity and research coverage for each path’s recent cohorts.
One more advantage of the American capital markets deserves emphasis up front, because it changes how the costs of each path should be weighed: the US market’s uniquely flexible follow-on financing system.
Once public and seasoned, a US-listed company can raise additional capital through shelf registrations, at-the-market (ATM) programs, registered directs, and convertible notes — often in days, at modest cost, with or without a new roadshow. The first listing is not the last financing; for most growth companies, it is the first of many. A path that positions the company well for that second and third raise can be worth a meaningful concession on investors’ first bite at the equity apple.
The Three Paths at a Glance
Before comparing outcomes, it helps to be precise about what occurs in each process. In plain terms:
The traditional IPO — a marketed sale of new shares
The company files a registration statement (Form S-1, or F-1 for foreign private issuers) with the SEC and engages investment banks as underwriters. After SEC review, management conducts a roadshow — typically one to two weeks of meetings with institutional investors — while the underwriters "build the book": collecting orders at indicated prices. The night before trading, company and underwriters set the offer price; the underwriters buy the shares and resell them to the investors they select, standing behind the deal with their own capital and their legal liability for the prospectus. On the first trading day, the underwriters can support the price using an over-allotment ("greenshoe") of extra shares. The company receives the offering proceeds, less an underwriting discount of roughly 5–7% on small- to mid-sized deals.
The de-SPAC merger — a negotiated merger with a listed shell
A special purpose acquisition company (SPAC) is a shell company that has already gone public, holding its IPO proceeds in a trust account (traditionally $10.00 per share) while it searches for a business to merge with. The target company negotiates a business combination agreement (BCA) with the SPAC’s sponsor, fixing the target’s valuation by contract. The parties then typically raise a PIPE (private investment in public equity) from institutional investors to supplement — in practice, often to replace — the capital in trust, because SPAC shareholders retain the right to redeem their shares for cash rather than stay invested in the merged company. After an SEC-reviewed proxy or registration statement and a shareholder vote, the merger closes and the target becomes the listed company, inheriting the SPAC’s exchange listing. The sponsor is compensated in "promote" shares — historically 20% of the shell’s equity — plus the SPAC’s warrants and rights remain outstanding.
The direct listing — opening a trading market without an offering
In a direct listing, the company registers existing shareholders’ shares for resale and simply begins trading — no new shares are sold, no capital is raised, no underwriter builds a book, and no one is obligated to support the price. The exchange sets a reference price (from private-market trading or, where none exists, from an independent third-party valuation the company commissions), and the stock opens through an auction in which whoever wishes to sell meets whoever wishes to buy. Existing holders can generally sell from the first minute of trading. Advisors assist with the process for a flat fee but do not underwrite. A variant permitting a capital raise at the opening auction has been allowed since 2020–2021 but remains almost unused.
Figure 1. Typical elapsed time from process kickoff to first trade. De-SPAC timing runs from a signed merger agreement and assumes the target is prepared with PCAOB-standard audits; the search and negotiation period before signing varies widely. Source: AUM Advisors.
Table 1. The mechanics side by side. Source: AUM Advisors.
Figure 2. US listing activity by path, 2023–2026 YTD (*through August 27, 2026). Traditional IPO counts per Renaissance Capital (market cap ≥$50mm, ex-SPACs); SPAC IPO and de-SPAC completion counts per SPAC Insider (2023 SPAC IPO count per Renaissance Capital); direct listings per Jay Ritter, Table 13a (updated August 27, 2026). Source: Renaissance Capital; SPAC Insider; AUM Advisors analysis.
Measuring What Each Path Delivers
Because companies go public for three reasons, we measure how the shares performed for the recent cohorts of each path, how liquid each trading market became, and how much research coverage each cohort attracted — coverage supporting both liquidity and validation. Share-price results appear throughout the path chapters that follow.
A note on the liquidity measure. The exhibits below report a 20-day average daily dollar volume measured to 10 September 2026, rather than the first-90-day and trailing-90-day windows originally specified. They therefore describe the current state of each cohort rather than its evolution, and we make no claim here about how liquidity changes over a cohort’s first months of trading.
Figure 3. Trading liquidity by path (2025 listing classes) Cohort medians for four groups: traditional IPOs of $100 million and above (n=67), small traditional IPOs (n=48), completed de-SPACs (n=37) and direct listings (n=8). The left panel shows median daily dollar volume; the right panel expresses the same volume as basis points of market capitalization. Dollar volume is a 20-day average measured to 10 September 2026. Medians, not averages, to prevent a handful of large names from masking the typical experience. Source: TIKR; AUM Advisors analysis.
Figure 4. Research coverage by path (2025 listing classes) For the same four cohorts: the average number of sell-side analysts publishing an active rating, with the number of companies carrying no coverage at all shown against each bar. Coverage is concentrated rather than evenly spread, so these averages are lifted by a small number of well-covered names; a company with no analyst record is treated as having none. Coverage is the clearest observable proxy for institutional visibility and a leading indicator of durable liquidity. Source: TIKR; AUM Advisors analysis.
What the Data Shows
Across these measures, large IPOs lead by sizable margins:
Median daily trading volume of $24.22 million against $1.04 million for small IPOs, $0.89 million for de-SPACs and $0.41 million for direct listings.
An average of 9.5 covering analysts against 1.2 for small IPOs, 1.4 for de-SPACs and 1.0 for direct listings.
However, measured as turnover as a percent of market capitalization rather than absolute volume, direct listings rank second at 73.3 basis points of market capitalization a day, ahead of de-SPACs at 71.4 and small IPOs at 59.3. That second-place ranking deserves careful reading: turnover measured against a market capitalization that has already collapsed reflects churn, not liquidity — in dollar terms, the median direct listing trades less than half the daily volume of the median de-SPAC.
Note also that small IPOs and de-SPACs are nearly indistinguishable on these measures — $1.04 million against $0.89 million of daily volume, and an average of 1.2 and 1.4 covering analysts respectively, with 77% of small IPOs and 65% of de-SPACs carrying no research coverage at all.
The key takeaways: SPAC mergers, small IPOs, and direct listings all typically require time to meet the liquidity thresholds required by most institutional investors. For this reason, they need to invest more time and energy in investor marketing post-listing and often will require a follow-on offering to cross over to become widely investable names. Second, companies going public via any of these three paths will need to invest in cultivating research coverage during the first year of being public, nurturing relationships, triangulating research with capital markets activities, and in some cases considering CMA agreements with targeted firms.
Path I: The Traditional IPO
The traditional IPO remains the default route for a reason: it is the only path that delivers all three objectives — capital, liquidity, and validation — in a single event, and it arrives with an infrastructure the other paths must build afterward, if they can build it at all.
What a well-executed IPO delivers
A broad institutional shareholder base from Day 1. The book-building process places shares directly with dozens of institutional investors selected by the underwriters — long-only funds, sector specialists, index-adjacent buyers — who have met management, studied the story, and chosen to own it. Every other path must earn that ownership one meeting at a time over the following one to two years.
Research coverage, promptly. Underwriting banks typically initiate sell-side coverage after the post-IPO quiet period — often three to five analysts within weeks for a mid-sized deal with quality underwriters. Coverage drives institutional visibility, valuation context, and trading volume; companies arriving by other paths typically face a research desert of six to eighteen months as they build up coverage relationships.
An actively traded stock in year one. Broad initial distribution, research, and index eligibility combine to produce the healthiest early trading of the three paths for IPOs of reasonable size.
Aftermarket support at the start. The greenshoe gives underwriters both the means and the incentive to stabilize early trading — a shock absorber neither of the other paths has.
The reputational premium. Fairly or not, "we completed our IPO on the NYSE/Nasdaq" carries more weight with customers, business partners, lenders, and potential acquisition targets than any alternative phrasing. For companies whose commercial strategy depends on credibility — enterprise sales, regulated industries, M&A programs — this is not a soft benefit; it shows up in win rates and deal terms.
Understanding the first-day pop — cost, signal, and strategy
The most discussed feature of the IPO is the first-day price jump. The long-run average first-day return is roughly 18% (Ritter, 1980–2025); in 2025 it was 19.7% across all US IPOs and about 25% for the $100 million-plus cohort.
Read one way, the pop is an implicit discount on the capital raised. It represents incremental value delivered to the investors who received allocations rather than to the company. That reading is real: on a $300 million raise, a 20% pop means roughly $60 million of pricing concession, several times the underwriting fee itself.
But the pop deserves a more nuanced reading too.
A first-day rise is, in one sense, the visible evidence of successful marketing: demand so far exceeded supply that investors received only partial allocations of the positions they wanted — and spent the following weeks buying more in the open market. That unfilled demand is not wasted; it becomes the aftermarket bid, the follow-on order book, and the shareholder base that supports the stock through its first few earnings cycles.
Companies whose plans include multiple future financings (and given the US market’s shelf registrations, ATM programs, and convertible market, most growth companies should plan for this) can rationally accept a pricing concession on the first raise to secure the investor base that makes the second and third raises cheap and fast. The IPO is best understood not as a single sale executed at the highest possible price, but as the opening transaction of a long-term financing relationship with the public market.
The practical guidance is therefore not "avoid the pop" but "make sure the concession buys something." A 15–25% pop with a high-quality institutional book, prompt research coverage, and active trading is a concession well spent. A deal priced to "pop" for optics, allocated to fast-money accounts that flip on Day 1, buys nothing. The difference lies almost entirely in underwriter selection and allocation discipline — which is where an issuer’s advisors earn their keep.
When the IPO is the right path
The IPO fits companies that can attract the focus and attention of quality underwriters — realistically, offerings of $50–100 million and up, businesses with financial profiles institutions can model, and stories that fit a two-week marketing window.
It fits companies that value the reputational premium, plan repeat financings and can accept pricing-day market risk. It fits less well for companies below the size threshold, for stories that need months rather than weeks to explain, and during windows when the IPO calendar is crowded with long-waiting mega-deals absorbing underwriter and investor attention — a real phenomenon in 2025–2026, when several of the largest offerings in years came to market after yearslong delays.
Path II: The De-SPAC Merger
The SPAC merger acquired a poor reputation in 2021–2023, much of it earned. But used selectively, it provides a legitimate and sometimes superior route to a US listing. The post-reform record shows a structure behaving increasingly like a disciplined capital-markets tool.
What the de-SPAC genuinely offers
Confidential, extended marketing for complex stories. An IPO gives management two weeks and a fixed prospectus. A de-SPAC allows months of confidential engagement with the sponsor and prospective PIPE investors before anything is public — invaluable for businesses whose value requires education: novel technology, unfamiliar markets, complicated histories.
Insulation from temporary market dislocations. An IPO prices on a single night; a tariff headline or a bad tape that week can cut the valuation or kill the deal. A de-SPAC’s valuation is fixed by contract months before close, and the process continues through market turbulence that would close the IPO window.
Certainty of becoming public. A company that signs a merger agreement and completes the process knows it will be listed. It does not risk spending millions on a withdrawn IPO — 36 IPOs were withdrawn in 2025 alone.
A fit for frontier-technology and "big bet" stories. Businesses in quantum computing, nuclear energy, space, critical minerals, defense tech, and similar fields may be difficult to model on near-term numbers, which makes conventional book-building awkward. The negotiated format — one sophisticated counterparty, then a PIPE syndicate underwriting a long-term thesis — suits them, and the results show it: at our July Scorecard, four of the seven H1 2026 de-SPACs trading above their $10.00 baseline were quantum computing companies, each of which closed with a PIPE of $100 million or more.
Speed, for the prepared. A target with PCAOB-standard audits and public-company financials in place can move from signed agreement to listing in three to six months.
No dependence on the underwriting queue. When capital markets are active, but the IPO pipeline is clogged with very large, very well-known deals that have waited years to launch, smaller issuers struggle for underwriter attention and calendar slots. The de-SPAC does not wait in that line.
The costs and risks — stated plainly
Dilution. The sponsor’s promote (historically 20% of the shell’s equity for nominal cost) plus outstanding warrants and rights can meaningfully dilute the combined company. This is the structure’s largest cost, and it must be counted honestly alongside any comparison to IPO fees.
A concentrated shareholder base and thin early trading. With trust redemptions running at a median of 89% in H1 2026, the post-close shareholder register is often little more than the PIPE holders and the sponsor. The practical consequences: low liquidity for roughly the first six months, extreme price volatility on small volume, which can be unnerving for employees holding equity and for business partners watching the ticker. The institutional universe mostly waits for 90–360 days of trading history and earnings track record before initiating positions.
The coverage desert. No underwriter syndicate means no automatic research initiation; most de-SPACs trade for six to twelve months before the first analyst arrives, and coverage must be earned through nurturing relationships on both the research and banking side, visibility at conferences, and consistent execution.
The residual "SPAC taint." The 2021–2023 meltdowns left a discount on the label itself. It is fading as post-reform winners accumulate, but a de-SPAC still starts with more skeptics than an IPO does.
What the evidence says
Across all 699 de-SPACs completed since 2010, only 14.9% trade above the original $10.00 trust price — the base rate that earned the structure its reputation. But the base rate is a rear-view mirror dominated by the bubble years. Of the 22 de-SPACs completed in the first half of 2026, five — 23% — trade above $10.00, well above the historical rate, and the market is sorting deal quality earlier and more accurately than at any point in the structure’s history. The single strongest predictor is committed institutional capital at close:
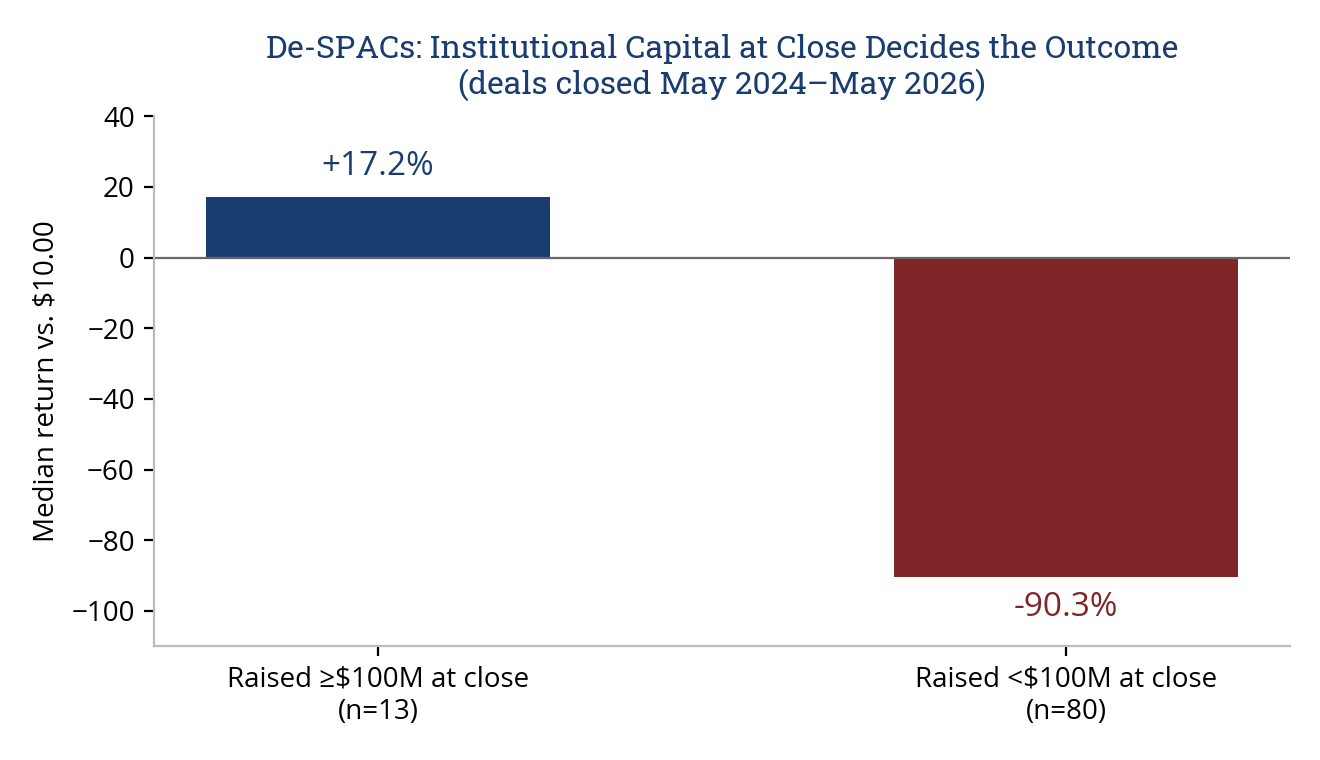
Figure 5. Median de-SPAC return vs. the $10.00 trust price by institutional capital raised at close (straight equity PIPE plus retained trust), deals closed May 2024–May 2026, n=93; p < 0.000001. Source: SPAC Insider; AUM Advisors analysis.
A de-SPAC that attracted $100 million or more of institutional capital at close posted a median return of +17.2% over the past two years; deals below that line posted −90.3%. The redemption vote tells the same story in real time: in H1 2026, every one of the three lowest-redemption deals trades above $10.00, while of the twelve deals that lost more than 90% of trust, exactly one does.
The practical translation for a board: the de-SPAC works when institutional investors, free to walk away, choose to fund your deal at size — and the PIPE process is where that verdict is delivered.
Everything is negotiable — and vehicle selection is half the outcome
The standard objection to the de-SPAC — the 20% promote — is increasingly out of date.
Our July 2026 study of every H1 business combination agreement, Everything Is Negotiable, documented ten distinct promote structures in a single half year period: promotes cut to a flat percentage of the combined company, promotes vesting only above $12.00, promotes forfeited on formulas tied to trust retention, and in one case a promote that changed hands at $1.75 per founder share. Earnouts, lockup schedules, non-redemption agreements, and forward purchases give a well-advised target multiple levers to align sponsor, PIPE, and company incentives.
The Takeaway: the terms a target achieves depend heavily on the vehicle it selects and the preparation it brings. Before signing with any SPAC, a board should understand the vehicle’s warrant and rights overhang (which survives the merger), the underwriter’s deferred compensation structure (fees contingent on closing shape advice), the trust’s extension history and remaining balance (a seasoned vehicle under deadline pressure negotiates differently than a fresh one), and the sponsor’s track record across prior deals. This diligence is unglamorous and decisive — and it is precisely the work an experienced, independent capital-markets advisor performs for the target, whose interests diverge from those of any other party at the table.
Path III: The Direct Listing
The direct listing solves a specific problem elegantly: a company that does not need to raise capital, but whose shareholders need liquidity and whose business benefits from a public currency, can list without dilution, without an underwriting discount, and without handing a first-day discount to allocated investors.
Spotify and a dozen other large, famous companies used it that way in 2018–2021, with strong long-run results.
The question for most readers of this guide is different: what does the path deliver for a mid-sized or smaller company that the public market does not yet know? The recent record supplies an unusually clear answer.
The legitimate case
For the right company, the advantages of a direct listing are real:
Exchange-listed status and a public currency without raising unneeded capital;
Liquidity for existing holders from Day 1, unconstrained by lockups;
No underwriting discount and no first-day transfer to allocated investors;
The option to raise capital later, as a seasoned issuer, through the follow-on machinery described earlier.
Creative investment banks have also developed structures that make the path reachable for smaller companies — typically a private placement to hedge funds and retail investors in the months before listing, which supplies the shareholder count and float the exchange requires, followed by the listing itself. A company taking this route usually sees it as a two-step plan: achieve public status now, raise capital later at public-market prices.
Why the path is growing — and why boards should understand the reason
Direct listings are having their highest-volume year ever — 18 in 2026 through late August, versus 9 in 2025 and 3 in 2024. Part of the growth is legitimate discovery of the structure.
Part of it, candidly, is regulatory arbitrage. Beginning in 2025, Nasdaq substantially raised the bar for small IPOs: minimum public-offering proceeds requirements, a rule that only offering proceeds (not previously registered resale shares) count toward the public-float tests, heightened standards for certain cross-border issuers, and broader discretionary authority to deny listings. Those reforms attach to offerings — and a resale-only direct listing has no offering, so it is not subject to the same scrutiny of allocation sizes and the identities of new investors.
For a company that would no longer qualify for the front door, the side door has become the path of least resistance. The listing tests still apply at elevated (200%) thresholds, but where no private trading market exists, they are measured against an independent third-party valuation that the company itself commissions — and how rigorously the exchanges evaluate those valuation analyses is, in our view, an open question in this corner of the market.
It is a question boards should ask, because the market has been rendering its own verdict on the answer.
What the record shows
Figure 6. Day-1 open-to-close returns for all 18 US direct listings completed in 2026 year-to-date with verified opening and closing prints. Median −13.8%; 11 of 18 closed below the opening print. QumulusAI, excluded from earlier drafts for want of a verified opening print, is now included at +63.8%. Source: Jay Ritter, Table 13a (updated 27 August 2026); exchange data; AUM Advisors analysis.
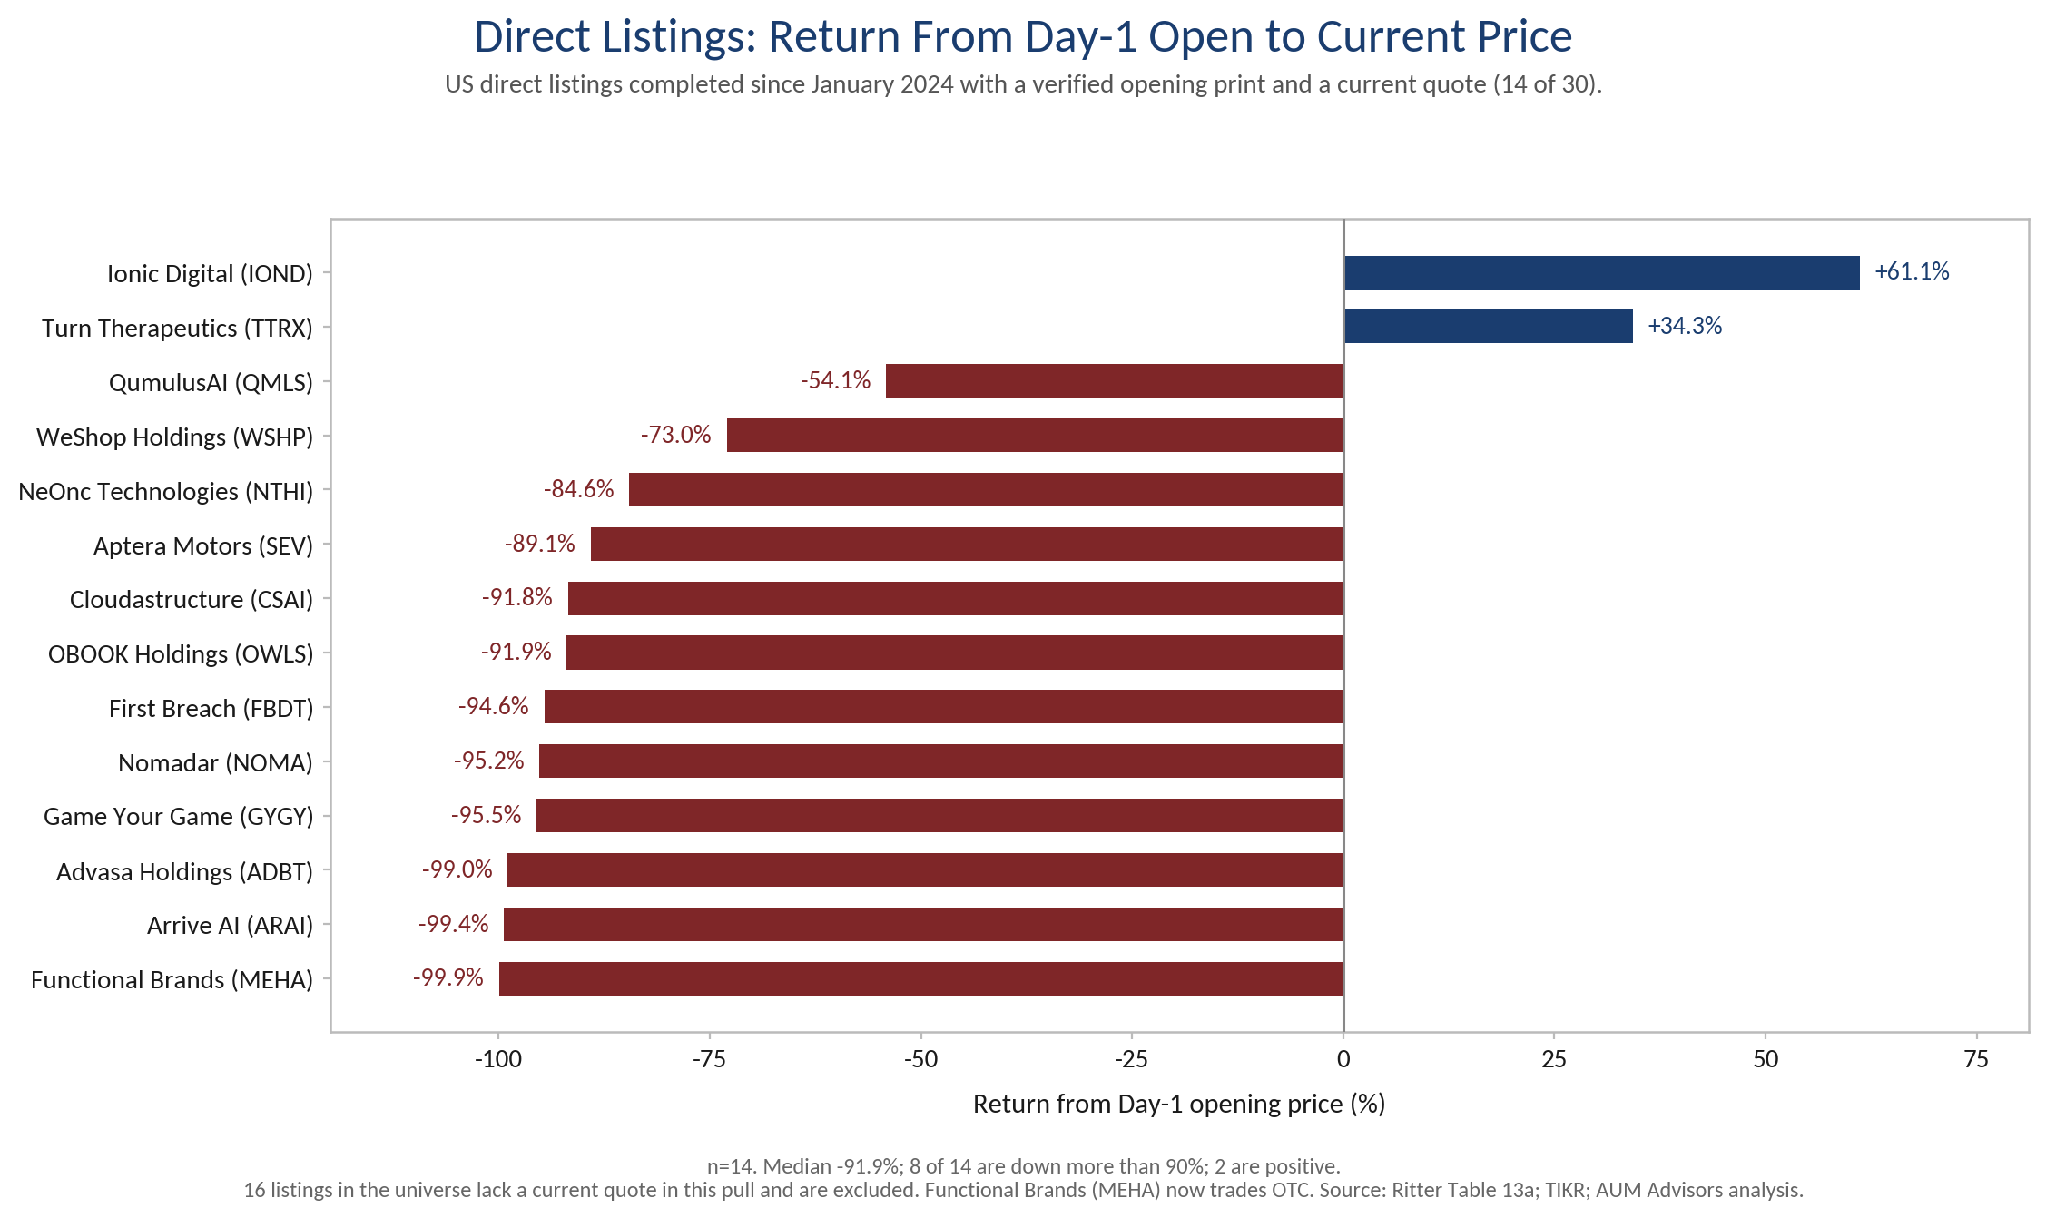
Of the 30 direct listings completed since January 2024 with verified trading data, 22 closed their first day below the opening price (median open-to-close: −25.6%). Measured to the current quote, the median direct listing in the sub-sample with live pricing has lost 91.9% of its opening value.
Two listings in the cohort trade above their open: Ionic Digital, up 61%, and Turn Therapeutics, up 34%. It is worth being precise about why, because Ionic is not an exception to the pattern; it is the pattern’s proof. Ionic arrived with a large pre-existing shareholder base (creditors of the Celsius Mining estate who already owned the equity), a $400 million institutional raise completed before listing at the $53 reference price, and bulge-bracket advisors. In other words, a real two-sided market existed before the opening auction. Every other company in the cohort asked the opening auction to create a market that did not yet exist, and the auction answered
The warning for boards considering the two-step plan — list now, raise later — follows directly: a listing that opens at an unrealistic valuation and collapses does not preserve the option to raise capital later; it poisons it. A company trading down 60–90% from its opening print faces financing alternatives that are dilutive at best and predatory at worst — discounted converts, variable-price instruments, equity lines — the very structures our de-SPAC research identifies as markers of subsequent failure.
A board choosing this path should want the same thing an IPO book provides: hard evidence, before listing day, that real investors will own the stock at the contemplated price. Where that evidence exists, the direct listing is efficient and honest. Where it does not, the opening auction will supply a verdict, publicly, and at the shareholders’ expense.
The Banks: Same Institutions, Three Very Different Jobs
The same investment banks appear in all three structures, but their role, economics, obligations, and legal exposure differ so much that a board should treat them as three different counterparties who happen to share letterhead. Understanding the differences explains much of what each path does — and does not — deliver.
Table 2. The banks’ role, economics, substance, and liability across the three structures. Source: AUM Advisors.
Three practical implications follow.
First, the IPO discount is not merely a selling commission — it prices capital commitment, statutory liability, and aftermarket obligations that the other structures’ fees do not include; comparing headline fee percentages across paths without adjusting for what the fee buys is a category error.
Second, in a de-SPAC the target should map every bank’s incentives when weighing its advice: an advisor holding deferred compensation payable only on closing is not neutral on whether the deal closes. Certain highly qualified de-SPAC advisors and placement agents may not have any credible research team, whereas other banks may request a CMA agreement that primarily secures research support and aftermarket marketing. Only one investment bank that we are aware of guarantees research on its SPAC IPOs. Right of first refusal deals on SPAC IPOs can act as an embedded poison pill, deterring research and trading support from other investment banks during the first year of trading.
Third, in a direct listing the advisor’s name on the cover, however prominent, does not import underwriter diligence, capital, or support — the prospectus itself will say so, and boards should read that sentence as literally true.
The Decision Framework
Three questions, answered honestly, narrow the choice quickly.
Do you need primary capital within the next twelve months? If yes, the direct listing in its current form is effectively out, and the choice is IPO versus de-SPAC. If no — genuinely no — the direct listing enters the frame.
How much pricing certainty do you need, and what is it worth? If your plans genuinely depend on a valuation fixed months ahead — pending acquisitions, contractual triggers, a complex story that needs long-form marketing — the de-SPAC’s negotiated price is a real advantage worth paying for, provided the terms are negotiated against the current market described above. If pricing-day flexibility is tolerable, the IPO’s book-built price costs less than boards assume once the follow-on benefits are counted.
If your shares started trading tomorrow with no marketing, would a real two-sided market exist? Not "is our company well known" — is it known to public-market investors, with a demonstrated willingness to own the stock at your contemplated valuation. Ionic Digital could answer yes, which is why its direct listing worked. If the honest answer is no, the direct listing is not a shortcut, and the choice between IPO and de-SPAC turns on Questions 1 and 2 plus the size threshold: companies below the scale that attracts quality underwriters should weigh the de-SPAC-with-institutional-PIPE route against the micro-cap IPO’s documented record.
The summary table
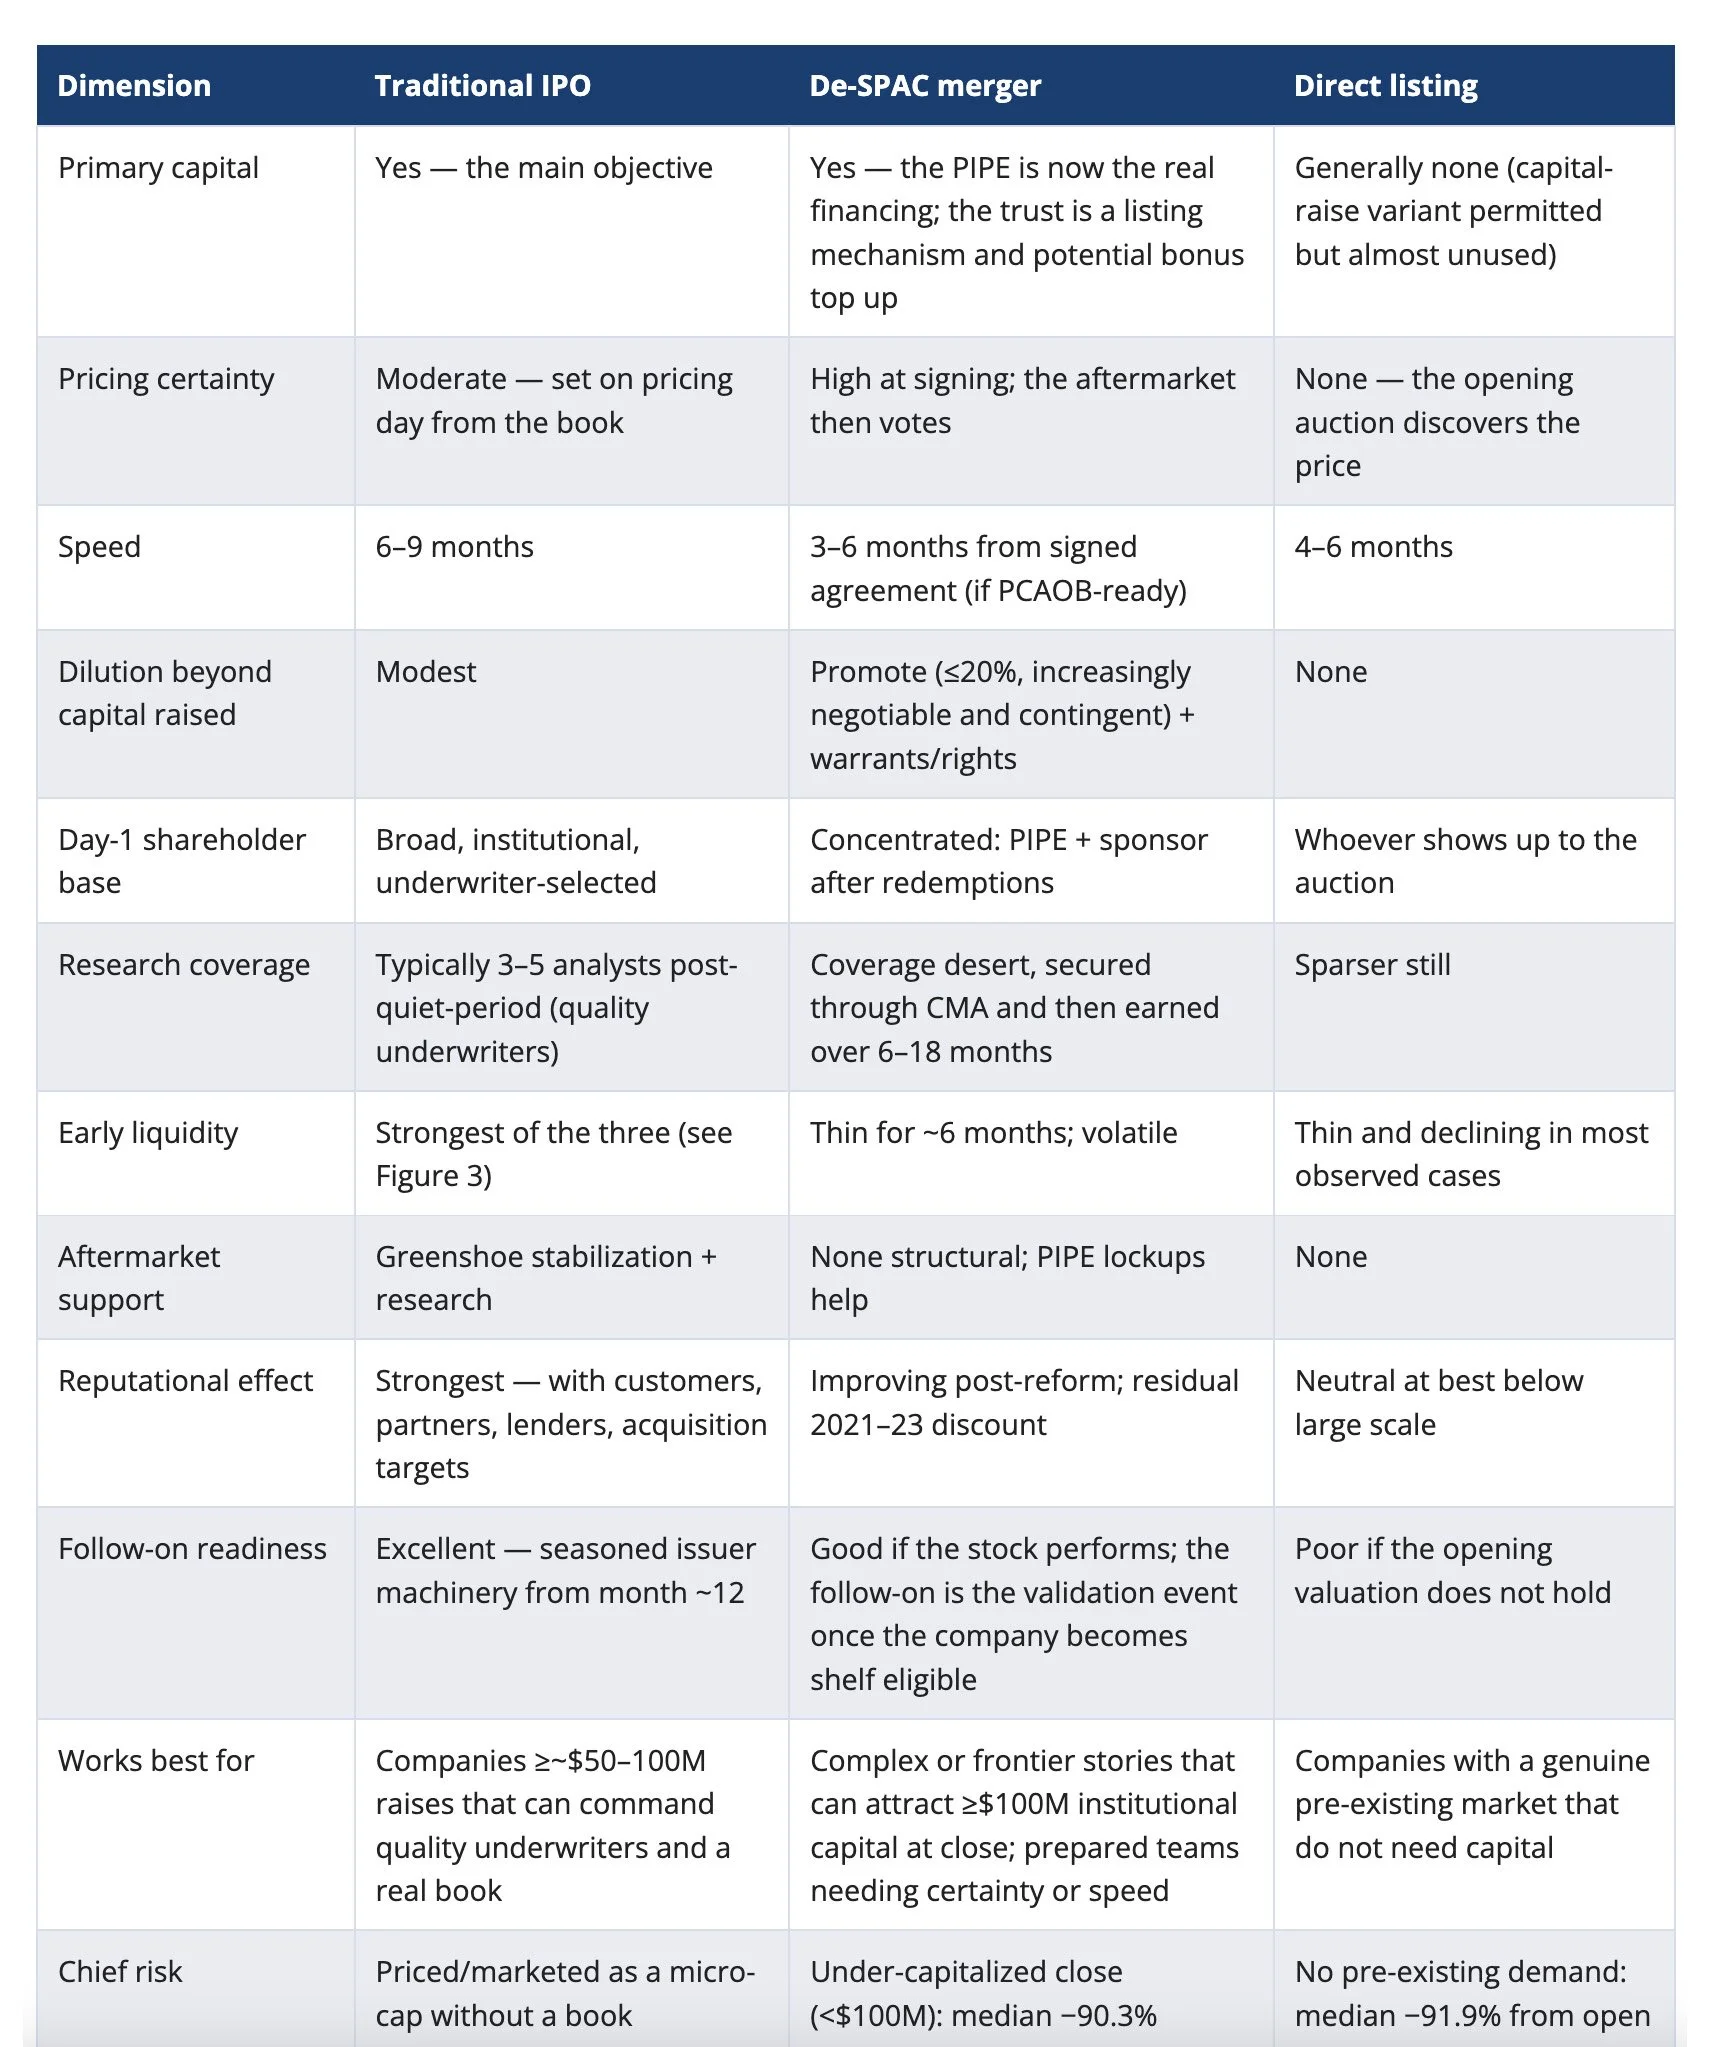
Table 3. The three paths, summarized against the 2024–2026 record. Sources: Renaissance Capital; SPAC Insider; Jay Ritter; exchange data; AUM Advisors analysis.
One requirement all three paths share
Whichever door a company chooses, the same public-company infrastructure must exist on Day 1: PCAOB-standard audits, internal controls on a SOX timeline, a board with qualified independent committees, disclosure policies and Reg FD training, a guidance framework designed to be beaten, and an investor-relations program built before — not after — the listing.
Our study The Five Disciplines of De-SPAC Success details this readiness build; the checklist applies with equal force to all three paths, and international issuers should begin it twelve to eighteen months before any target listing date.
The Cross-Border Dimension
For international companies, the US listing decision carries additional considerations — and, increasingly, the record to inform them, because the current cycle is the most international in US market history. Foreign issuers accounted for 57% of 2025 US IPOs. Twenty of the 47 de-SPAC targets announced in H1 2026 — 43% — are headquartered outside the United States, across Europe, Asia-Pacific, Canada, and the Middle East; the H1 winners include Finnish, Singaporean, and Canadian technology companies making their US debuts. And in August 2026 a Tokyo-headquartered fintech completed the first Japanese direct listing on Nasdaq.
Every door is now a cross-border on-ramp. The lessons of the record, though, apply with extra force abroad:
The size threshold bites harder. Smaller international issuers have defaulted for years to the micro-cap US IPO — the path with the weakest documented outcomes of any in this guide. An international board offered a $10 million US IPO should compare it, seriously, against a de-SPAC with a committed institutional PIPE — and against waiting to do a larger offering that will support real institutional interest.
The de-SPAC has quietly become an institutional-quality cross-border on-ramp. IQM Quantum Computers — the Finnish quantum hardware leader — closed its merger on July 1, 2026 with modest redemptions and an upsized $145 million PIPE that brought Finnish pension institution Ilmarinen alongside existing holders: a model of a European deep-technology company reaching US capital with institutional validation intact; as of early September, it trades modestly above its $10.00 baseline, at $10.80.
The direct listing’s cautionary record is disproportionately international. OBOOK Holdings (Taiwan) reached a $4.9 billion Day-1 valuation in October 2025 and trades 92% below its opening print, at $5.48. Advasa Holdings (Tokyo) opened at $12.00 on August 25, 2026, and closed its first day at $6.26 — down 48% — with home-market retail investors supplying much of the demand. It has since fallen to $0.13, more than 98% below its opening print. Cross-border issuers weighing this path face the additional reputational cost of a visible failure in their home market, where the next financing, the next customer, and the next hire are watching.
Case Studies: The Paths in Practice
Ionic Digital (IOND) | Direct listing done right | July 2026 | +61% from open
Ionic Digital emerged from the Celsius Mining estate with a large creditor shareholder base that already owned the equity, added a $400 million institutional raise at the $53 reference price before listing, and engaged J.P. Morgan, Jefferies, and BTIG as advisors. The stock opened at $50, closed its first day at $62.90, and has since reached $80.56 — one of only two direct listings since January 2024 trading above its open. The lesson: the direct listing works when the two-sided market exists before the auction. Ionic built one first.
PayPay (PAYP) and DSC Holdings (DSC) | Two IPO markets, one year | 2026
The clearest illustration of the two-tier IPO market is two Asian issuers that listed on Nasdaq within three months of each other.
PayPay — SoftBank’s Japanese payments platform, profitable on $2.3 billion of revenue — priced its $880 million IPO on March 12 at $16.00, cutting below its $17–$20 range during one of the year’s most volatile weeks rather than postponing. The full package arrived on schedule: the stock opened 19% up and finished its first week +32%; ARK bought on Day 1; seven or more analysts initiated after the quiet period (Jefferies at Buy/$28, with Bank of America, Wolfe, Morgan Stanley, Mizuho, Citi, and Cantor following); and the ADSs trade millions of shares daily at a $10–11 billion capitalization. Six months on, the shares have recovered to $17.04, slightly above the $16.00 issue price — and the outcome is still a success on every objective in this guide: PayPay banked roughly $497 million of primary capital, its early holders are near whole, and it enters its first follow-on window with the coverage, ownership, and liquidity that were the point of the exercise.
PayPay (PAYP) and DSC Holdings (DSC) | Two IPO markets, one year | 2026
The clearest illustration of the two-tier IPO market is two Asian issuers that listed on Nasdaq within three months of each other.
PayPay — SoftBank’s Japanese payments platform, profitable on $2.3 billion of revenue — priced its $880 million IPO on March 12 at $16.00, cutting below its $17–$20 range during one of the year’s most volatile weeks rather than postponing. The full package arrived on schedule: the stock opened 19% up and finished its first week +32%; ARK bought on Day 1; seven or more analysts initiated after the quiet period (Jefferies at Buy/$28, with Bank of America, Wolfe, Morgan Stanley, Mizuho, Citi, and Cantor following); and the ADSs trade millions of shares daily at a $10–11 billion capitalization. Six months on, the shares have recovered to $17.04, slightly above the $16.00 issue price — and the outcome is still a success on every objective in this guide: PayPay banked roughly $497 million of primary capital, its early holders are near whole, and it enters its first follow-on window with the coverage, ownership, and liquidity that were the point of the exercise.
DSC Holdings — an Ant-backed Chinese used-car-software company with 90% share of its niche — raised $51 million on June 25 at $17.00 with Deutsche Bank and CICC on the cover. The names were blue-chip; the deal was not: three million ADSs, a float of roughly 6% of shares outstanding, and no book depth behind it. The stock opened below issue at $16.00, fell to $5.77 within four trading days, and sits near $8.00 — down more than 50% from the offer — with minimal coverage and thin volume. The lesson: the IPO’s advantages are features of scale and distribution, not of the legal form — and not even of the letterhead. A $51 million offering cannot buy the product an $880 million offering buys, whoever underwrites it. Buy the real product or choose a different door.
StablecoinX | Capital is necessary, not sufficient | June 2026 | −21% vs. $10.00 after an 80% drawdown
The largest PIPE of H1 2026 — $893 million from prominent digital-asset investors — belongs to a deal that closed with 99.6% of trust redeemed after a four-and-a-half-year SPAC life spanning eight extensions and traded down roughly 80% as of our July Scorecard; it has since recovered to $7.93, 21% below the $10.00 trust price. A nine-figure PIPE can fund a balance sheet; it cannot substitute for an operating story that gives public investors a reason to hold. The lesson: every quantitative threshold in this guide is necessary, and none is sufficient. The de-SPACs that work are businesses first and financings second.
Conclusion: Match the Path to the Company
There is no best path to a US listing. There are three different transactions, with three different counterparties, three different cost structures, and three different first years as a public company — and a record, now measured across more than 1,100 transactions, of which kinds of companies each one rewards.
The IPO rewards scale and quality sponsorship with the fullest package the public markets offer.
The de-SPAC rewards preparation, negotiation, and the ability to attract committed institutional capital — and punishes their absence swiftly.
The direct listing rewards the rare company the market already knows how to price and teaches every other kind an expensive public lesson.
The board’s task is not to pick the path with the best brochure; it is to identify, honestly, which description fits the company — and then to prepare so thoroughly that the chosen path’s advantages can be realized.
That preparation — vehicle diligence, term negotiation, investor targeting, readiness build, and the communications program that turns a listing into a liquid, covered, institutionally owned public company — is where the outcome is decided, on every path. It is also, not coincidentally, where experienced independent advice earns its place at the table.
The structure does not determine the outcome. The match between the structure and the company does — and the record now shows exactly what a good match looks like on each path.
About AUM Advisors
AUM Advisors is a senior advisory firm specializing in investor relations, capital markets strategy, and investor communications for international issuers and complex US capital markets situations, including IPOs, de-SPACs, direct listings, and cross-border transactions. The firm’s principals have counseled management teams on more than 100 IPOs, SPACs, and follow-on transactions across the US, Japan, Europe, Greater China, and Southeast Asia. AUM Advisors engages only with companies whose business model and governance it can stand behind: selectivity is a design principle, not a constraint.
Companion research: The Five Disciplines of De-SPAC Success (June 2026) · The De-SPAC Scorecard (quarterly) · Everything Is Negotiable: De-SPAC Deal Terms (July 2026). Contact: Crocker Coulson, Founder & CEO | crocker.coulson@aumadvisors.com | (646) 652-7185 | aumadvisors.com
Data Sources, Methodology, and Disclosures
IPO data: Renaissance Capital US IPO Market Annual Reviews (2024, 2025) and 2026 YTD statistics (IPOs and direct listings, market cap ≥$50mm, ex-SPACs and closed-end funds). Long-run first-day return data: Jay Ritter, University of Florida. 2026 YTD proceeds include one $75 billion listing accounting for more than half the total.
De-SPAC data: SPAC Insider universe; AUM Advisors analysis as published in the companion studies. Returns split-adjusted, measured against the $10.00 SPAC IPO price.
Direct-listing data: AUM Advisors dataset of all US direct listings since January 2024, reconciled against Jay Ritter’s Table 13a (updated 27 August 2026); Day-1 prices verified against official exchange closing prints, split-adjusted. Current prices are as of 10 September 2026 for listings completed in 2024 and 2025, and 14 September 2026 for those completed in 2026. The universe is 30 listings; 14 carry both a verified opening print and a live current quote, and the return statistics measured to the current price are computed on that sub-sample.
This guide is for informational purposes only and is not investment, legal, or tax advice, an offer to sell, or a solicitation of an offer to buy any security. Past performance is not indicative of future results.
Weighing a US listing?
AUM Advisors counsels international management teams and boards on IPOs, de-SPAC mergers, direct listings, and the investor-relations build that turns a listing into a liquid, covered, institutionally owned public company.
Request a consultation with Crocker Coulson →
Companion research: The De-SPAC Scorecard · All AUM insights